

Supportive Relationship - Choosing the right partners.
"The right people around you should recognize your progress, not diminish it. Evaluate relationships by how they respond to your achievements." https://t.co/QrVzDG6t4J
"The right people around you should recognize your progress, not diminish it. Evaluate relationships by how they respond to your achievements." https://t.co/QrVzDG6t4J

1
0
2
198
0
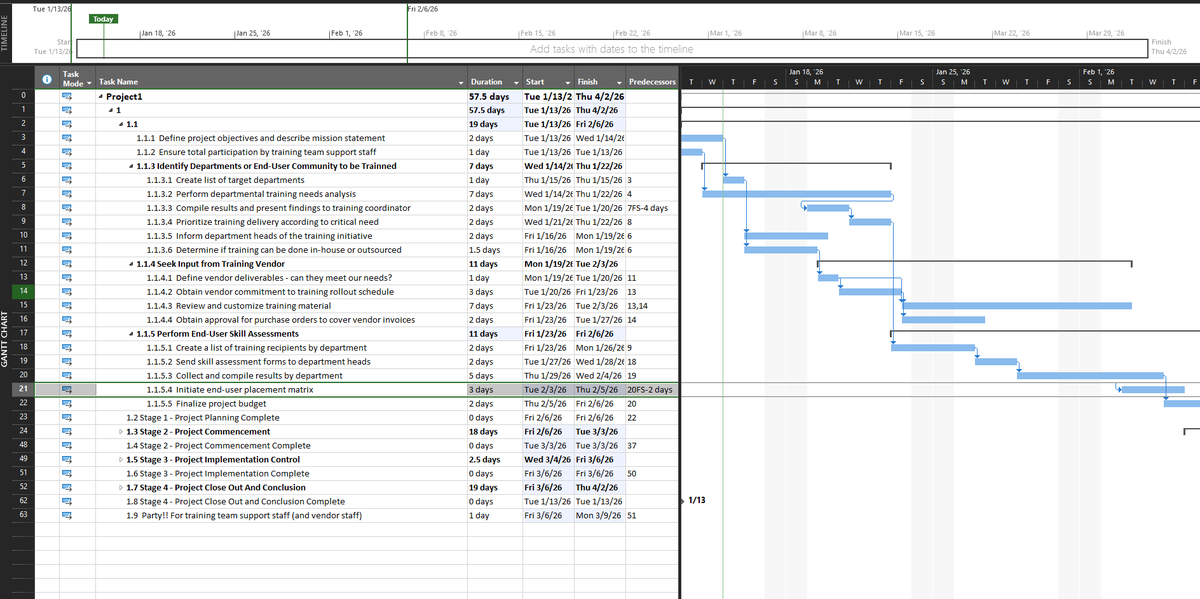
Why Gantt Charts Matter Most During Project Planning
One thing I’ve learned about projects is this: how you plan determines how smoothly everything else will go. https://t.co/47Fog8ASbs
One thing I’ve learned about projects is this: how you plan determines how smoothly everything else will go. https://t.co/47Fog8ASbs
1
0
1
71
0
A Gantt chart is a visual timeline of a project. It shows the tasks that need to be done, how long each task will take, and when each task starts and ends. Instead of reading through long task lists or schedules, you can see the entire project laid out in a clear, time-based view https://t.co/oAOvsxTNIZ
1
0
3
95
0
Project Manager (PMP Track) | Real Estate | Planning, Execution & Results
95 Followers
3 Contributions
174
Total Members
+ 0
24h Growth
+ 1
7d Growth
Date Members Change
Jun 14, 2026 174 +0
Jun 13, 2026 174 +0
Jun 12, 2026 174 +0
Jun 11, 2026 174 +0
Jun 10, 2026 174 +0
Jun 9, 2026 174 +1
Jun 8, 2026 173 +0
Jun 7, 2026 173 +0
Jun 6, 2026 173 +0
Jun 5, 2026 173 +0
Jun 4, 2026 173 +0
Jun 3, 2026 173 +0
Jun 2, 2026 173 +0
Jun 1, 2026 173 —
No reviews yet
Be the first to share your experience!
Share Your Experience
Sign in with X to leave a review and help others discover great communities
Login with XLoading...
Connecting project management practitioners to share best practices, drive innovation, and foster collaboration across industries
Community Rules
Mostra una actitud amable i respectuosa.
Publica contingut sobre el tema.
Explora i comparteix.