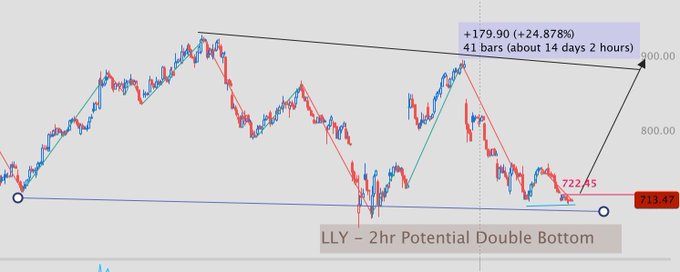

$LI Charts flashing buy - #DYOR #Stocks #LI
0
0
0
111
0
https://t.co/0B8YiW4spE
0
0
1
138
0
You plan to buy the dip at support.
You end up chasing the breakout at resistance.
You plan to take profit at 10%.
You end up holding through the reversal.
You plan to cut losses at 5%.
You end up "believing in the company" at -30%.
The gap between your plan and your
You end up chasing the breakout at resistance.
You plan to take profit at 10%.
You end up holding through the reversal.
You plan to cut losses at 5%.
You end up "believing in the company" at -30%.
The gap between your plan and your
0
0
0
208
0
$LCID up 2.5 % Nicely set up for a possible 20% upside
1
0
10
2.3K
0
Post & pray = stall. Insert yourself into high-traffic discussions with quote replies. Full strategy: https://t.co/FL0iJ0jjCu
0
0
0
208
0
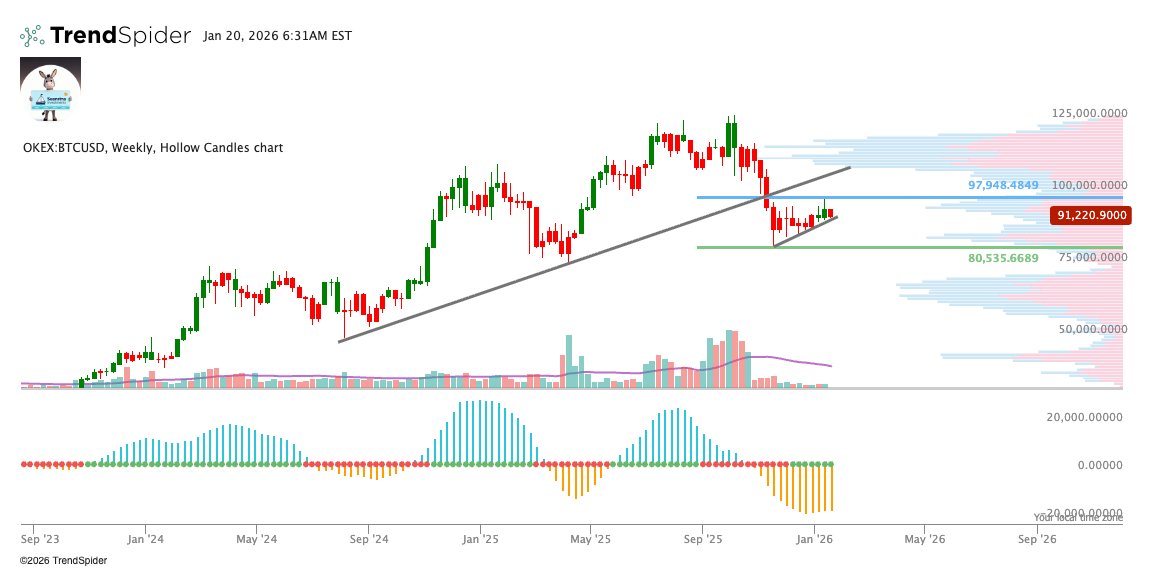
$BTC - Tired of random Bitcoin takes? I dropped a Bitcoin Weekly Guide for Jan 20, 2026 clear structure, key levels, and 2 scenarios so you’re not trading headlines. #Bitcoin: ~$91k (bearish structure) Decision points: $88–90k support vs $97–98k reclaim Bear case: $80–85k → https://t.co/khHzpdZVEG
0
0
0
570
0
$MSTR is a Buy #DYOR
0
0
0
221
0
Clarity Act catalyst for Coinbase rise to 290-300 this week. $COIN $CONL
0
0
1
520
0
$SPY are you ready?
0
0
0
127
0
$AMD 209.5 , showing strength as $SPY breaks out. $220 target on deck in quick time #AMD #Stocks
0
0
0
120
0
$LAC Head and Shoulders pattern breakout with Gamma Squeeze
0
0
0
111
0
Wall St vet decoding markets for real people 🔍 | Big money flows, macro & emerging tech 💸🌍🚀 | Contrarian, no‑BS signal for investors and traders - No Noise.
2.0K Followers
11 Contributions
206
Total Members
+ 0
24h Growth
+ 0
7d Growth
Date Members Change
Jun 14, 2026 206 +0
Jun 13, 2026 206 +0
Jun 12, 2026 206 +0
Jun 11, 2026 206 +0
Jun 10, 2026 206 +0
Jun 9, 2026 206 +0
Jun 8, 2026 206 +0
Jun 7, 2026 206 +0
Jun 6, 2026 206 +0
Jun 5, 2026 206 +0
Jun 4, 2026 206 +0
Jun 3, 2026 206 +0
Jun 2, 2026 206 +0
Jun 1, 2026 206 —
No reviews yet
Be the first to share your experience!
Share Your Experience
Sign in with X to leave a review and help others discover great communities
Login with XLoading...
Actionable stock charts that visualize stock price movements over time and identify potential trading opportunities by interpreting patterns and price action
Community Rules
Be kind and respectful.
Keep posts on topic.
Explore and share.